Replicating Global CEO Priorities
Blinded head-to-head test vs. The Conference Board’s 2026 C-Suite Outlook

IN COLLABORATION WITH |
The Test: Replicate Human Rank Ordering
Modeled 500 simulated global CEOs
Compared to 770 human global CEOs
Fielded across North Am, Europe, and Asia
The Conference Board’s C-Suite Outlook is an established annual executive benchmark
Blind comparison (no access to results)
0.78
Spearman rank correlation across 99 ranked items
1.28
Average rank position difference
100%
Questions matched at least one top-3 priority
Rank Drift by Question
Ordered by mean drift
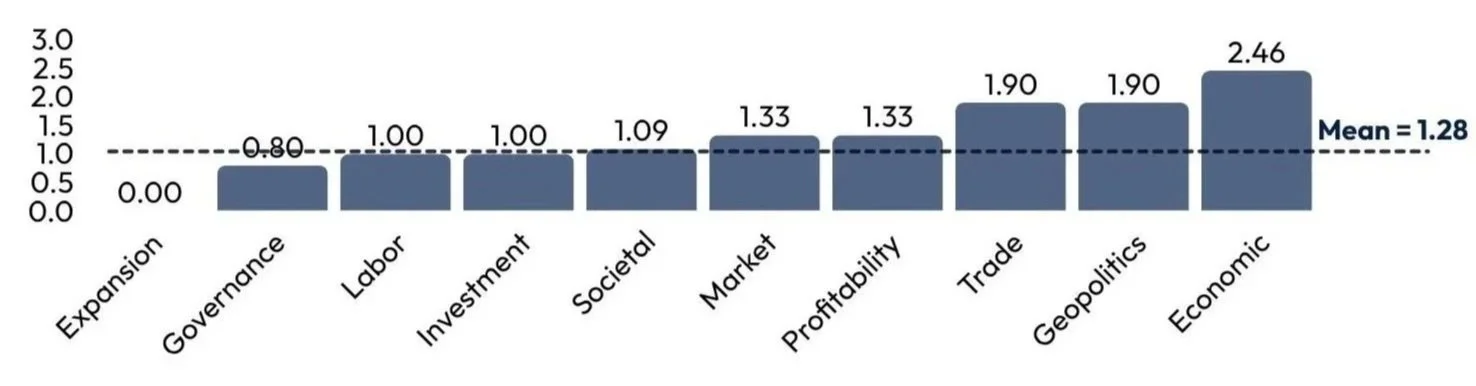
Across 10 questions, mean drift remained within a ~2.5-position band. Despite differences in regional and sector composition, no tuning was applied.
Independent Reaction
“There wasn’t one question of the 10 where one of the top three rankings did not match.”

Ivan Pollard
Leader, Marketing & Communications Center
The Conference Board
Former Global CMO, General Mills
Former SVP, The Coca-Cola Company
“Going in blind and matching as closely as they did is pretty impressive.”

Jeanne Shu
Strategic Projects Lead, Economy, Strategy & Finance Center
The Conference Board

Simulated modeling reproduced executive priority structure in a blind rank-order test.